


This blog post was authored by Simplecast's CTO, Stephen Hallgren
We’ve been hard at work to introduce even deeper insights into your shows on Simplecast. While downloads are a great metric for determining your overall volume, they are one piece to a much bigger puzzle about how your show is doing. Just like marketers expect more than just Facebook page likes or website page views, we know podcasters need more information. Downloads tell us that someone listened to a particular episode at a specific time, but at Simplecast we want to help you answer deeper questions. Questions like…
- Does your show keep listeners coming back for more?
- Do marketing efforts help attract new listeners?
- Do marketing efforts create new “sticky” listeners?
We’ve been running these metrics internally, and have been sharing them with our partners for feedback and refinement. Needless to say, the data has been invaluable to our shows, and we’ll be releasing them to our Professional customers in the months ahead.
The Data
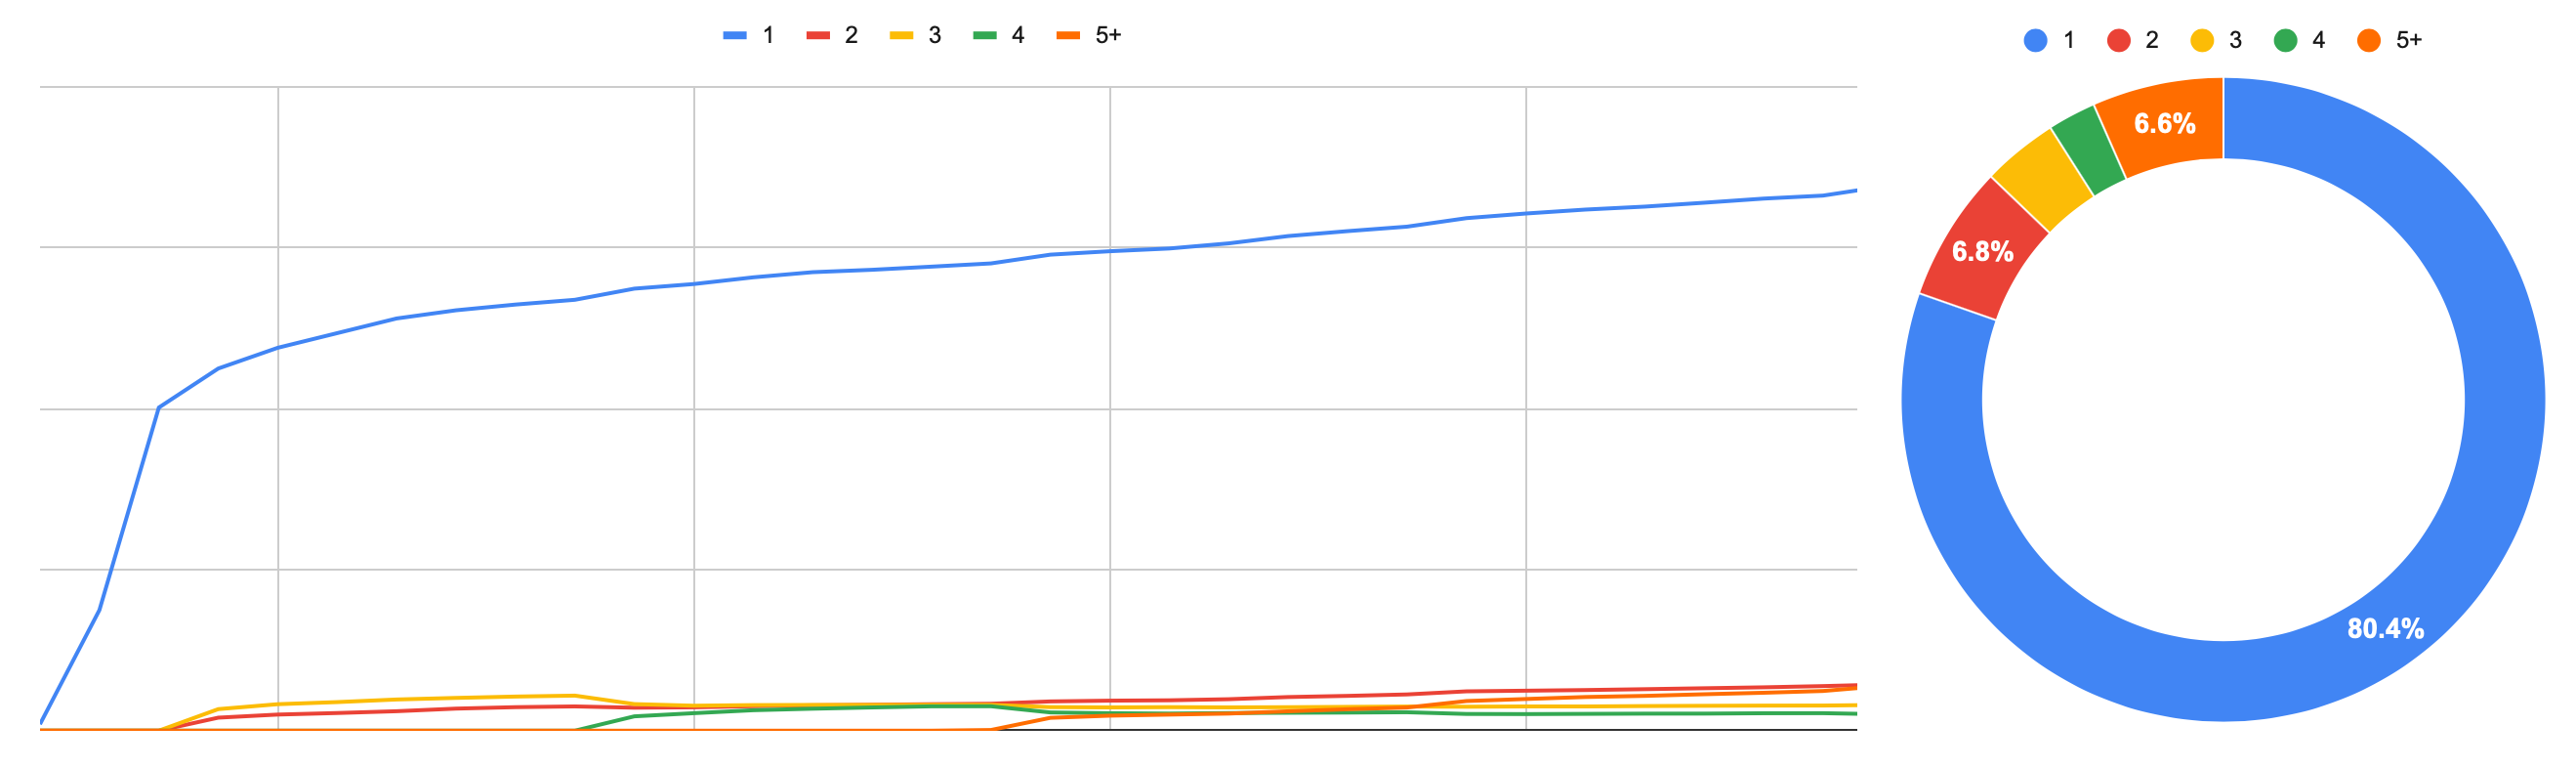
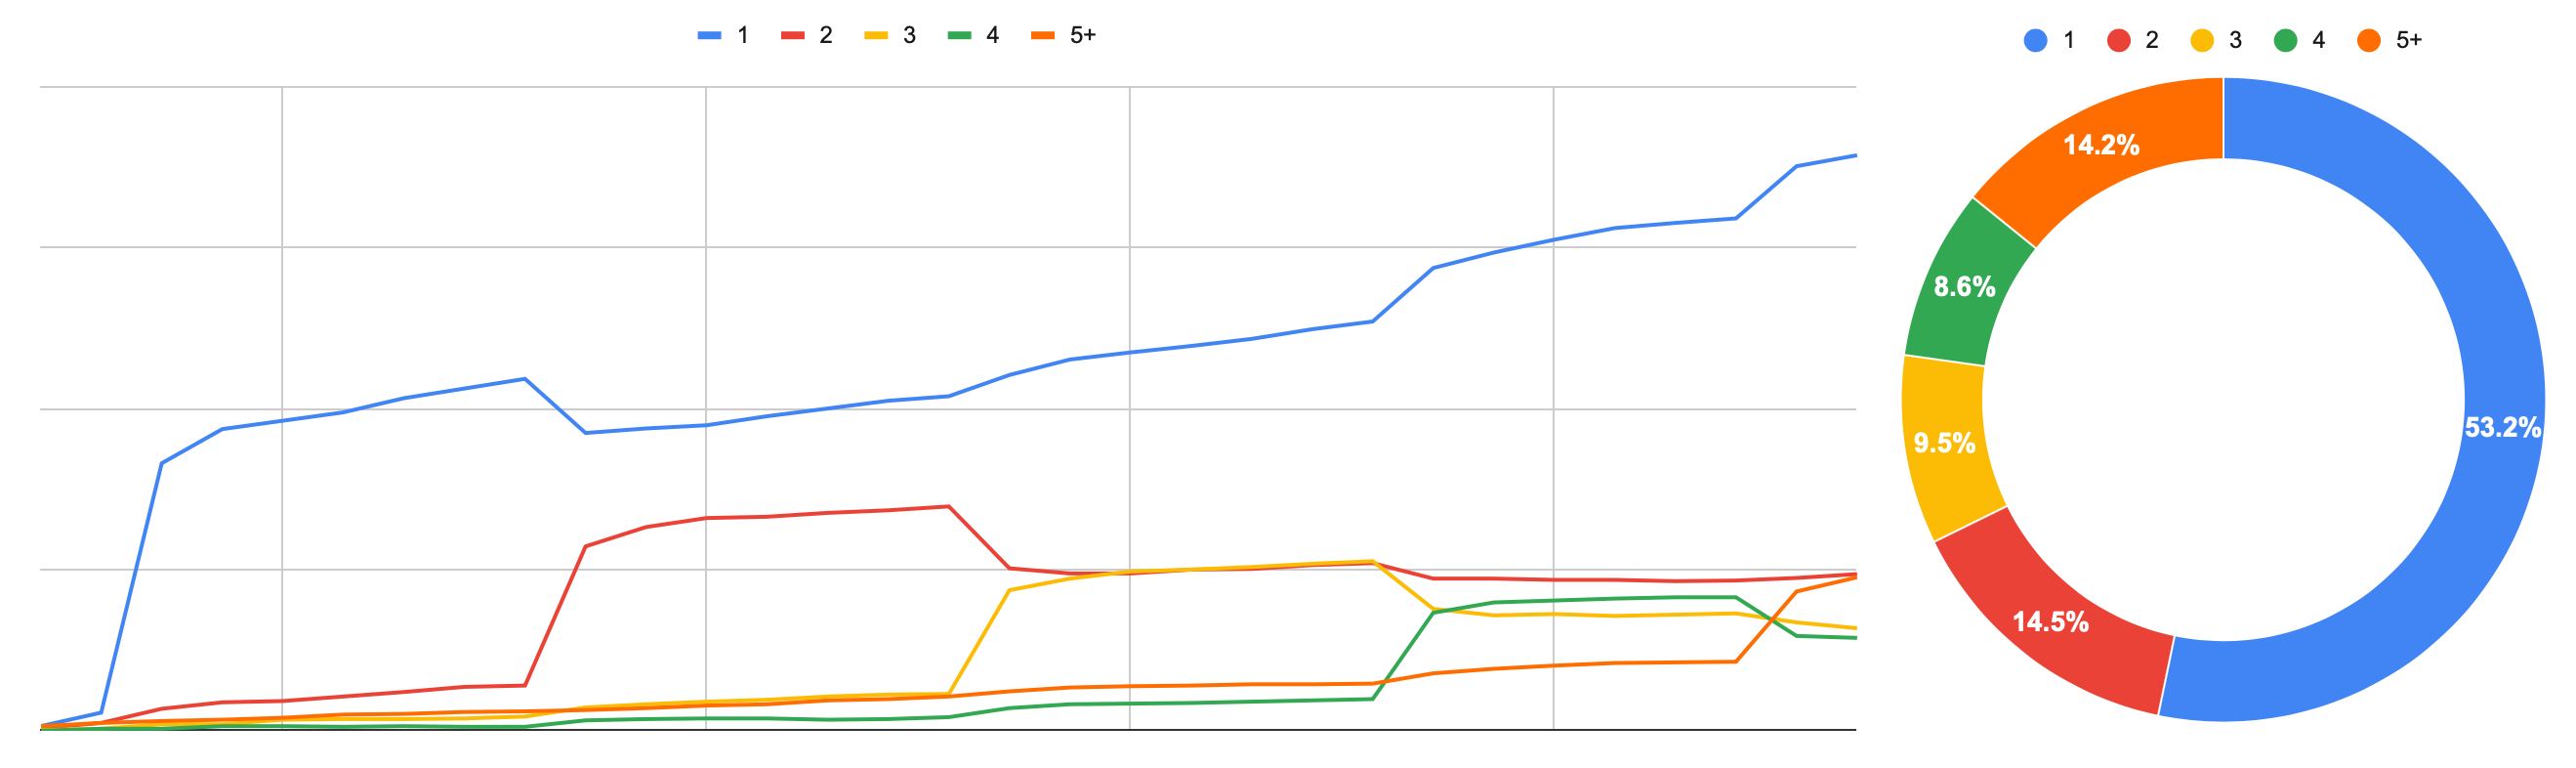
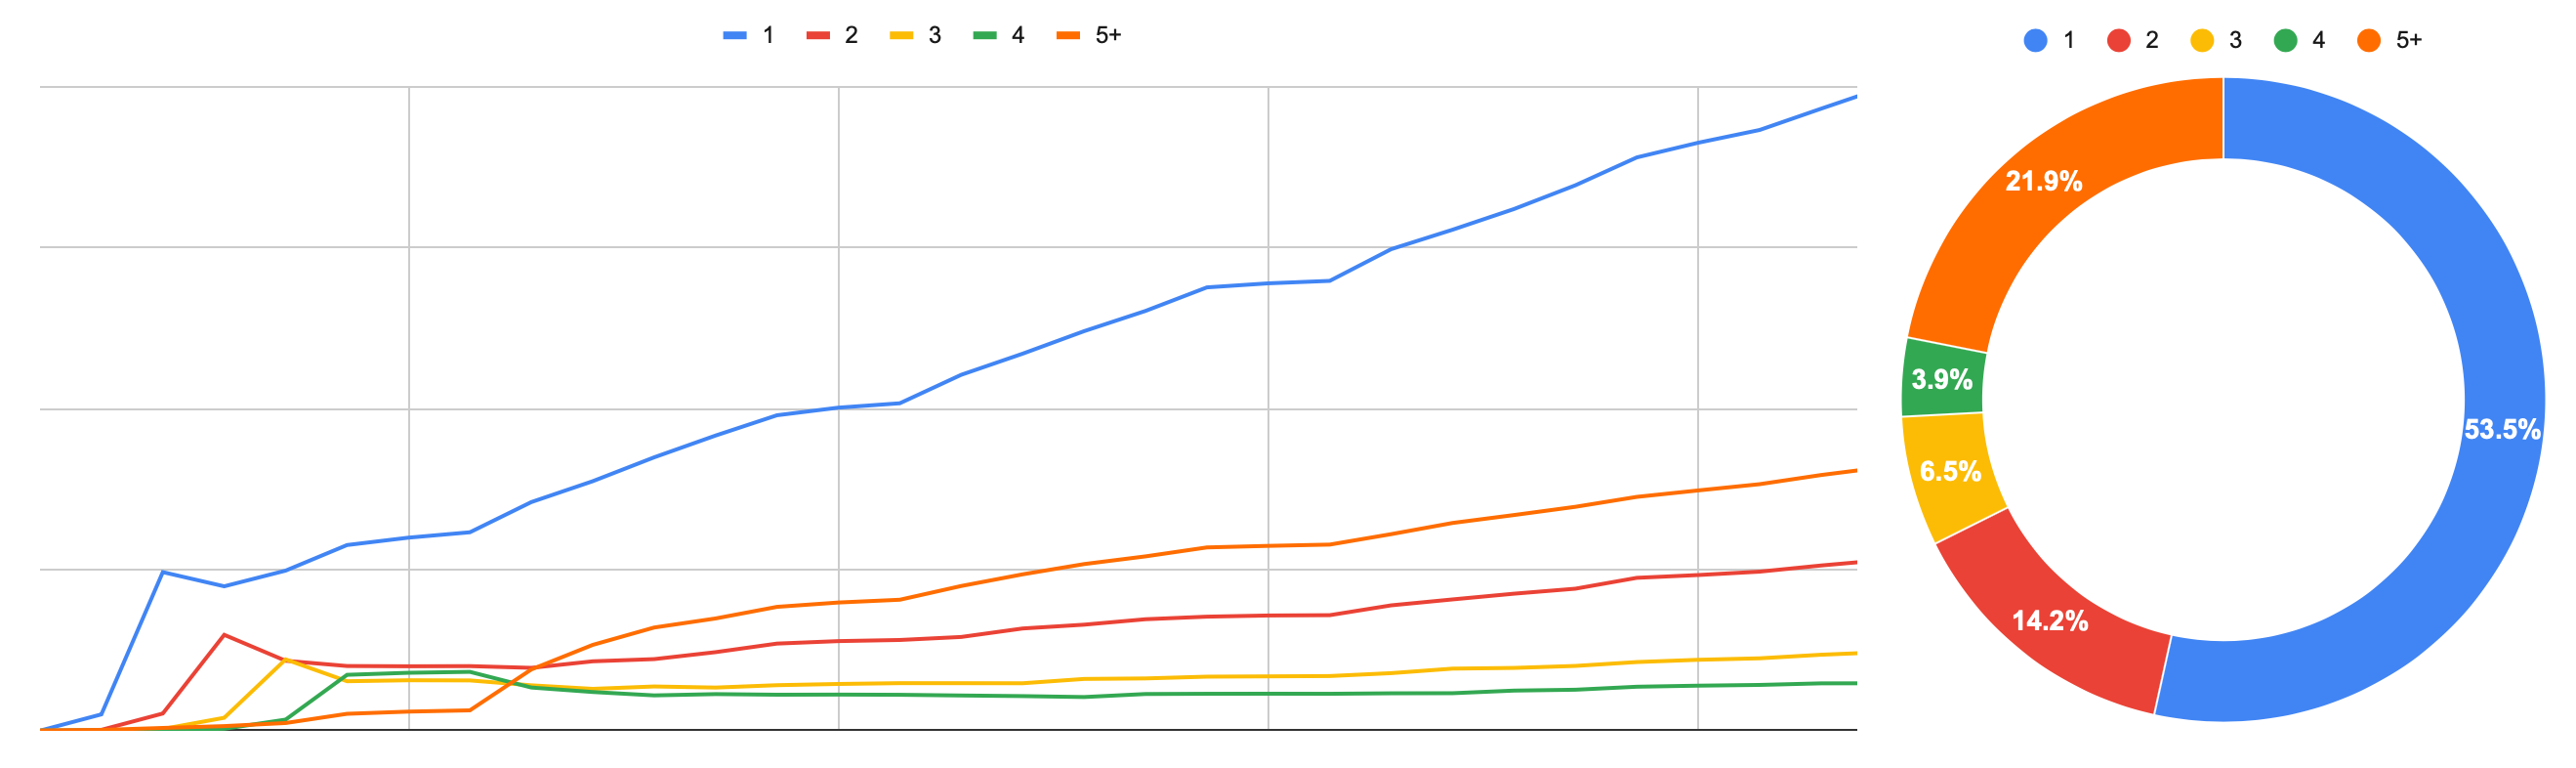
For the data in the charts, I’m using Simplecast’s metrics to look at specific shows and map out the unique listener count (y-axis) over time (x-axis) for the first month after the show’s launch day. For the y-axis I’m grouping unique listeners by how many episodes they have listened to. The complete breakdown of uniques and how many episodes they have listened to at the end of the first month is expressed in the donut chart.
While I only selected a few shows for this article, I’ve chosen them to illustrate a few different scenarios of a show’s launch. Show #1 is a weekly show with a big initial launch day (eg. featured in apps like Stitcher and Apple Podcasts), Show #2 is a weekly show with an organic growth trajectory (eg. word of mouth or current available audience), and Show #3 is a daily show and also has an organic growth trajectory.
Without further ado, here are the graphs and then I’ll dive into my thoughts.
Observations
When looking for stickiness (listeners who keep coming back for more), I’d expect and hope to see listeners transitioning from 1 to 2 to 3+ episodes for each episode release. I’d also hope to see the percentages for single episode listeners to be low.
For each of the sample shows you can see the transitions of listeners moving on to subsequent episodes, but it’s pretty clear that not all shows are equally sticky. Show #1 had a huge launch day and while they pulled in significant numbers, only ~20% of those listeners listened to at least one additional episode. Show #2 and #3 had significantly smaller launch days, with Show #2 being the smallest, but their listeners were much more engaged and were likely to keep listening to more episodes.
Volume vs. stickiness
How do you measure the success of your show? One might argue that getting a LOT of listeners, even though the percentage of repeats is low, is still a win. For Show #1, their launch day downloads are through the roof. An advertiser might see this as amazing, but the truth is, subsequent episodes didn’t perform nearly as well, and the show doesn’t seem compelling enough for listeners to keep listening.
Types of shows like daily news, celebrity interviews, audio dramas or educational shows will definitely influence stickiness, but it’s important to remember that most successful shows will be able to entice their listeners to listen to additional content.
First timers
It isn’t surprising that shows have lots of one-time listeners, but there are a few reasons that this number can vary widely across many different shows:
- Lots of people sample shows that are featured, but aren’t actually super interested in the show itself.
- Listeners don’t always start listening at the beginning of the show and may not have been hooked by the episode they listened to.
- A listener is only interested in a specific topic that a particular episode covers.
- Someone might listen to an episode, but never take the steps necessary to know when new episodes are released (eg. subscribe in an app).
Uniqueness Over Time
It’s important to remember that while we try our best to ensure that a unique listener is never counted more than once, it is possible that a listener’s uniqueness may change. Despite this possibility, the trends stay mostly the same regardless of the timeframe. Shows keep similar splits and trajectories regardless of if you take a sample from the beginning of the show’s life or its end.
Frequency of Episodes
The frequency of how often episodes are posted doesn’t seem to make a significant difference in how many people convert from a single listen to many. Increasing episode frequency does cause repeat listeners to convert quicker and drive growth, but at the end of the day, the content of the episodes will be the main factor for causing someone to keep listening.
The Future
I literally stay up at night thinking about all the different and exciting ways these analytics can help provide deeper and more valuable insights into our Simplecast shows. This obsession for giving our shows better analytics is why Simplecast is a platform unlike any you’ve seen before.
Stickiness is just one of many amazing pieces to understanding episodes and shows. Combined with other analytics that Simplecast is working on, like podcast onramps and episode entry points, and user behavior across episodes (another analytics insight I’m itching to talk about), our show creators will continue to understand more and more about what is and isn’t working for their shows.